
Crosstabs - Getting Headings to Show When There is No Data
- Nov 15, 2014
- 1 min read
Crosstabs (cross tables) are a great element to use in your report but since the data becomes the column and row headings, it is challenging when there is missing data. For example, in the crosstab below you'll notice California has all the months but Colorado doesn't have $ for February or July so those months are missing in the Colorado crosstab.

One way to handle that is to create a second query that pulls in all the months and then merge the months from both queries. To demonstrate:
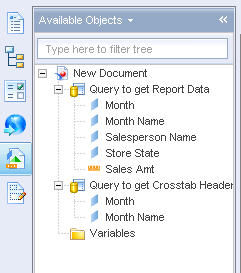
Edit the query and add a second query with only the objects used in the column header. (Note that the crosstab in our example uses Month for sorting, but it is a hidden dimension, which is why you don't see it in our screenshot above).

Be aware that if you are accessing a very large table to grab all the heading values you may want to uncheck the "Retrieve duplicate rows" checkbox in the query properties.

Run the new query. You now have one query with all your data and the other with just months, which returned Janauary-December.
Depending on your document properties, these objects may automatically merge. In this case, they did not so we will merge them.


Once all crosstab heading object are merged you replace the existing crosstab heading(s) with the merged dimension.

Notice Colorado now displays February and July even though there are no values for those.

This is a great technique that can be used anytime you have a crosstab. The alignment makes the crosstab much easier to read. Happy Thanksgiving.


Comments